
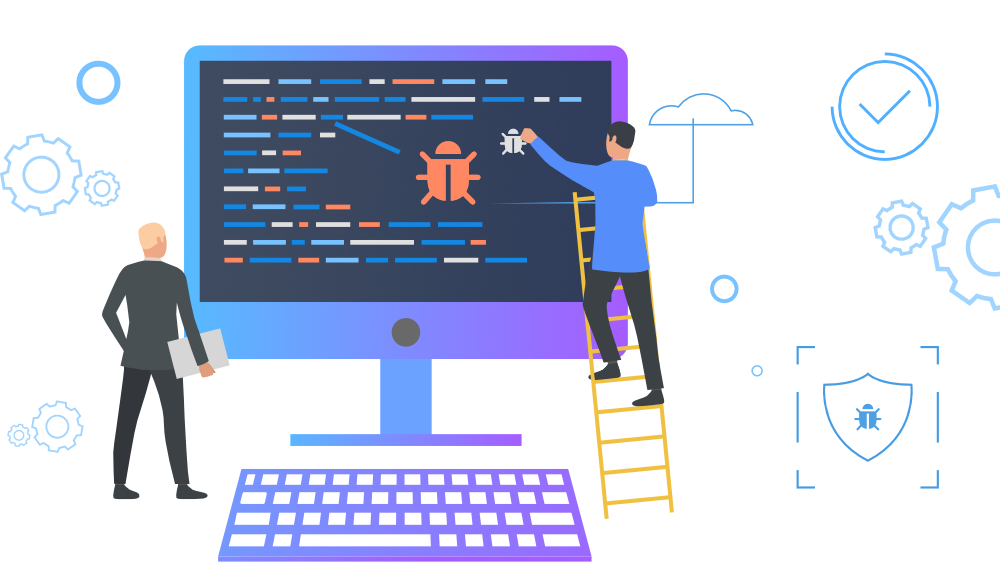
Debugging is a crucial skill in web development, helping you identify and fix issues that affect the functionality and performance of your website or application. Effective debugging techniques and tools can save time and ensure a smoother development process. This guide provides tips and tools for debugging common web development issues.
1. Identifying Common Issues
Before diving into debugging tools, it’s helpful to understand common issues that developers encounter.
- JavaScript Errors: Problems in your JavaScript code can lead to broken functionality or unexpected behavior.
- CSS Styling Issues: Incorrect or conflicting CSS rules can cause layout problems or styling inconsistencies.
- HTML Structure Problems: Issues with HTML structure can affect the rendering of content and functionality.
- Performance Bottlenecks: Slow-loading pages or inefficient code can impact user experience and site performance.
2. Using Browser Developer Tools
Browser developer tools are essential for debugging web issues. Most modern browsers offer built-in tools for inspecting and debugging web pages.
- Console: Use the Console tab to view and log JavaScript errors, warnings, and informational messages. You can also execute JavaScript commands directly.
javascript
console.log('Debug message');

console.error('Error message');
- Elements: Inspect and modify HTML and CSS in real time using the Elements tab. Check element styles, layout, and structure.
- Network: Monitor network requests and responses to troubleshoot issues with API calls, slow loading, or failed resources.
- Sources: Debug JavaScript code by setting breakpoints and stepping through code execution using the Sources tab.
- Performance: Analyze page performance and identify bottlenecks with the Performance tab. Record and review detailed performance data.
3. Using Debugging Tools
Several debugging tools and extensions can enhance your development process.
- Chrome DevTools: A comprehensive set of tools for debugging and profiling web applications. Includes features like Lighthouse for performance audits and the Coverage tab for checking unused code.
- Firebug: An older tool for Firefox that provides similar features to Chrome DevTools, including HTML, CSS, and JavaScript debugging.
- Visual Studio Code Debugger: A powerful debugger integrated into Visual Studio Code. Supports JavaScript, TypeScript, and other languages with features like breakpoints, watch variables, and call stacks.
- Postman: A tool for testing and debugging API requests and responses. Allows you to send requests, view responses, and analyze API interactions.
4. Debugging JavaScript
JavaScript errors can disrupt your web application’s functionality. Here are tips for debugging JavaScript effectively.
- Use
console.log(): Insertconsole.log()statements to track variable values and code execution flow.javascript
console.log(variableName);
- Set Breakpoints: Use breakpoints in browser developer tools to pause code execution and inspect variables and call stacks.
- Check Error Messages: Review error messages and stack traces in the Console tab to understand the cause of JavaScript errors.
- Utilize Debugger Keyword: Insert the
debuggerkeyword in your code to trigger a breakpoint in the debugger.javascript
function myFunction() {

debugger;

// code to debug

}
5. Debugging CSS
CSS issues can affect the layout and appearance of your site. Use these techniques to troubleshoot CSS problems.
- Inspect Elements: Use the Elements tab in browser developer tools to view and modify CSS properties in real time.
- Check Computed Styles: View computed styles to understand the final values applied to an element and identify conflicting rules.
- Use CSS Overlays: Tools like Visual Studio Code’s CSS Peek feature or browser extensions like CSS Peeper can help visualize and manage styles.
- Validate CSS: Use CSS validators like the W3C CSS Validator to check for syntax errors and compatibility issues.
6. Debugging HTML
HTML issues can impact how content is rendered and interacted with. Here’s how to debug HTML effectively.
- Validate HTML: Use HTML validators to check for syntax errors, missing tags, and structural issues.
- Inspect HTML Structure: Use the Elements tab to inspect and modify HTML elements. Ensure proper nesting and closing of tags.
- Check for Accessibility: Use tools like Lighthouse or the aXe extension to identify accessibility issues in your HTML.
7. Debugging Performance Issues
Performance issues can affect the user experience of your site. Use these methods to diagnose and fix performance problems.
- Analyze Network Requests: Use the Network tab to monitor request and response times, identify slow-loading resources, and troubleshoot network issues.
- Profile JavaScript Execution: Use the Performance tab to record and analyze JavaScript execution, identify long-running scripts, and optimize performance.
- Optimize Assets: Check for large images, unoptimized scripts, and excessive CSS rules that may slow down page load times.
- Use Performance Audits: Tools like Lighthouse provide detailed performance audits and recommendations for improving site speed and efficiency.
8. Continuous Integration and Testing
Automated testing and continuous integration (CI) can help catch and resolve issues early in the development process.
- Write Unit Tests: Create unit tests to verify individual components and functions. Use frameworks like Jest or Mocha for JavaScript testing.
- Implement CI/CD: Set up CI/CD pipelines to automate testing and deployment. Tools like Jenkins, Travis CI, and GitHub Actions can help streamline the process.
- Monitor Error Logs: Use error monitoring tools like Sentry or LogRocket to track and analyze errors in production environments.
Conclusion
Effective debugging is essential for building reliable and high-performing web applications. By using browser developer tools, debugging tools, and following best practices for JavaScript, CSS, HTML, and performance debugging, you can identify and resolve issues efficiently. Implementing continuous integration and automated testing further enhances your ability to maintain and improve your web projects.